| Unai Emery xG overperformance by club relative to other managers (2017-2025) | ||||
| Club | Matches (Emery) | xG overperformance per match (Emery) | Matches (Other) | xG overperformance per match (Other) |
|---|---|---|---|---|
| Paris Saint-Germain | 46 | 0.624 | 323 | 0.309 |
| Arsenal | 71 | 0.300 | 316 | 0.201 |
| Aston Villa | 125 | 0.254 | 127 | 0.015 |
| Villarreal | 117 | 0.202 | 249 | 0.027 |
| xG overperformance = goals minus expected goals. | ||||
Unai Emery: the xG whisperer
football
statistics
Unai Emery
Aston Villa
Premier League
Part two: Breaking down Emery’s xG performance by club, and looking at player effects and game state.
This is part two of a multi-part look at Unai Emery and his apparent habit of outperforming expected goals (xG). In part one, I showed that xG is a more predictive statistic than points or goal difference, and that Emery ranks third among all managers for xG overperformance during the study period (2017-2018 to 2024-2025).
Next, I want to drill down on Emery’s stints at PSG, Arsenal, Villarreal and Aston Villa during those seasons. We know from part one that his teams, cumulatively, have scored more than their expected goals for, and conceded fewer than their expected goals against. But where have these gains come from?
An obvious starting point is to break it down by club. Here we can see a breakdown of Emery’s total xG overperformance at each of the four clubs, with attacking overperformance in blue and defensive overperformance in orange.
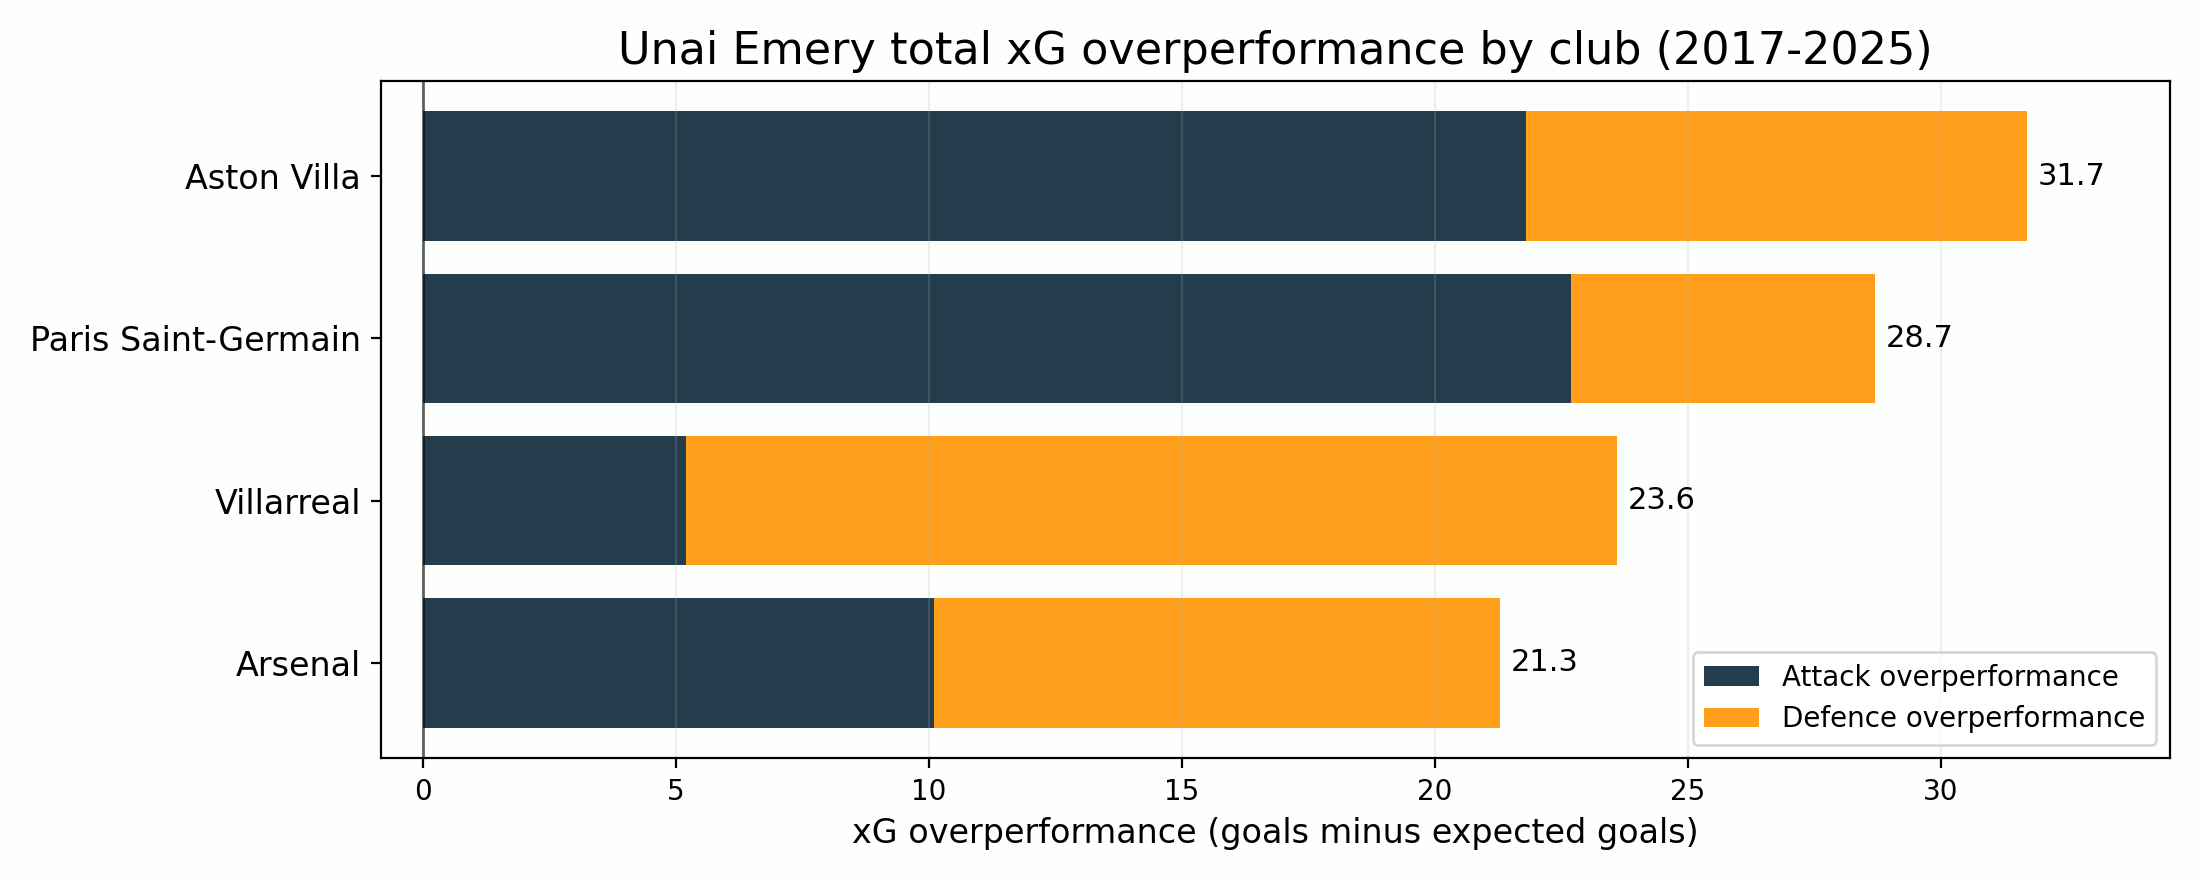
All four clubs, with Emery as manager, have performed better than their xG in both attack and defence. The largest overperformance came at Aston Villa where, up to the end of the 2024-2025 season, Emery outperformed xG by 31.7 goals. With both Villa and PSG, the majority of overperformance came in attack, whereas at Villarreal the majority was on the defensive end. At Arsenal it was close to a 50:50 split.
There is an obvious question to be raised, especially with respect to PSG and Arsenal: is this just about having better players? These are wealthy clubs that can sign better-than-average footballers in every position; it’s no wonder that they will excel at whatever aspects of the game the xG models cannot capture.
This is a fair point, so let’s take a look at how these clubs have performed, relative to xG, with and without Unai Emery as manager during the study period:
Again, I want to reiterate that this is a measure of goals relative to xG - it does NOT measure whether the xG is high or low in the first place. Just because Emery outperformed his xG by an average of 0.3 at Arsenal, does not mean he got better results overall than the managers that outperformed their xG by an average of 0.201.
Nonetheless, it is clear that Emery has done better, relative to xG, at each of the four clubs than all the other managers collectively. It is also evident that PSG and Arsenal have outperformed xG (by 0.309 and 0.201 per game, respectively, without Emery) across all managers, whereas Aston Villa and Villarreal are close to neutral under non-Emery managers, backing up the hypothesis that wealth begets talent which begets xG overperformance.
Is it just about having better players?
If we suspect that star players may be driving some of the ‘Emery effect’, let’s take a look at the 10 goalscorers who have exceeded their xG by the most while playing for Emery teams between 2017 and 2025:
| Greatest total xG overperformers under Unai Emery (2017-2025) | ||||||
| Player | Shots (Emery) | Total xG overperformance (Emery) | per shot (Emery) | Shots (Other) | Total xG overperformance (Other) | per shot (Other) |
|---|---|---|---|---|---|---|
| Jhon Durán | 92 | 6.49 | 0.071 | NA | NA | NA |
| Alex Baena | 37 | 6.31 | 0.171 | 202 | −6.45 | −0.032 |
| Edinson Cavani | 132 | 6.26 | 0.047 | 201 | −1.45 | −0.007 |
| Neymar | 118 | 5.52 | 0.047 | 392 | 4.76 | 0.012 |
| Gerard Moreno | 206 | 4.58 | 0.022 | 424 | −4.69 | −0.011 |
| Yeremi Pino | 58 | 3.92 | 0.068 | 86 | −6.18 | −0.072 |
| Alexandre Lacazette | 124 | 3.76 | 0.030 | 481 | 6.83 | 0.014 |
| Morgan Rogers | 97 | 3.64 | 0.038 | NA | NA | NA |
| Ollie Watkins | 288 | 3.52 | 0.012 | 201 | −3.87 | −0.019 |
| Mesut Özil | 17 | 3.36 | 0.198 | 57 | −0.12 | −0.002 |
| xG overperformance = goals minus expected goals. | ||||||
Leading the way is Jhon Durán, who seemed to score everything he looked at in the first half of the 2024-2025 season, including the incredible 35-yard winner against Bayern Munich. Because Durán arrived at Villa from MLS and left to Saudi Arabia, we do not have any non-Emery results for him in the dataset for comparison.
Of the 10 names on the list, only Neymar and Alexandre Lacazette recorded a positive xG overperformance under other managers. Edinson Cavani underperformed his xG in subsequent seasons with PSG, Man Utd and Valencia. Ollie Watkins has now established himself as a star striker at Emery’s Villa, but had previously been seen by many as a hard-working forward but a mediocre finisher.
Alex Baena, meanwhile, experienced an outrageous run of finishing in his short time playing for Emery’s Villarreal, scoring 9 times from only 37 shots and gaining 6.31 goals over xG; yet without Emery, his shooting boots deserted him, completely negating the hot run (-6.45 goals). Yeremy Pino, now of Crystal Palace, experience a similar turnaround (+3.92 to -6.18) as did Gerard Moreno (+4.58 to -4.69).
The impact of defenders on opposition finishing is a bit harder to quantify, but we can take a look at goalkeepers. Post-shot expected goals (PSxG) can be used to model the probability of a goal being scored after the ball is struck (an off-target shot therefore being worth zero) and we can calculate a goalkeeper’s “goals prevented” by subtracting the actual number of goals conceded from their total PSxG. The following table contains all goalkeepers who played more than 5 games for Emery’s teams during the study period.
| Goalkeepers under Unai Emery (2017-2025) | ||||||
| Goalkeeper | Matches (Emery) | Goals prevented (Emery) | per match (Emery) | Matches (Other) | Goals prevented (Other) | per match (Other) |
|---|---|---|---|---|---|---|
| Emiliano Martínez | 121 | 8.9 | 0.074 | 102 | −3.4 | −0.033 |
| Gerónimo Rulli | 70 | −1.4 | −0.020 | 125 | −10.0 | −0.080 |
| Bernd Leno | 48 | 2.7 | 0.056 | 213 | −12.3 | −0.058 |
| Sergio Asenjo | 43 | −3.8 | −0.088 | 101 | −2.3 | −0.023 |
| Alphonse Areola | 42 | 1.2 | 0.029 | 157 | −3.8 | −0.024 |
| Petr Čech | 18 | 0.0 | 0.000 | 37 | −1.8 | −0.049 |
| Robin Olsen | 14 | −4.7 | −0.336 | 65 | −5.6 | −0.086 |
| Goals prevented = PSxG minus goals against. Minumum 5 matches played under Emery. | ||||||
Emiliano Martinez and Bernd Leno both experienced a similar difference between Emery and other managers - about 0.1 goals per match. Gerónimo Rulli’s difference was slightly lower (0.06) but still positive. Only Villarreal’s Sergio Asenjo, of goalkeepers playing 40+ games, had a worse performance relative to PSxG under Emery than under other managers.
Game state
Something that gets neglected when people throw around aggregated statistics is context. A team that is down by one goal has very different incentives than a team that is leading by one goal, and will vary their tactics accordingly. We can break down Unai Emery’s teams by game state (i.e. the number of goals they are leading or trailing by at any point in the match) and see how their xG overperformance varies.
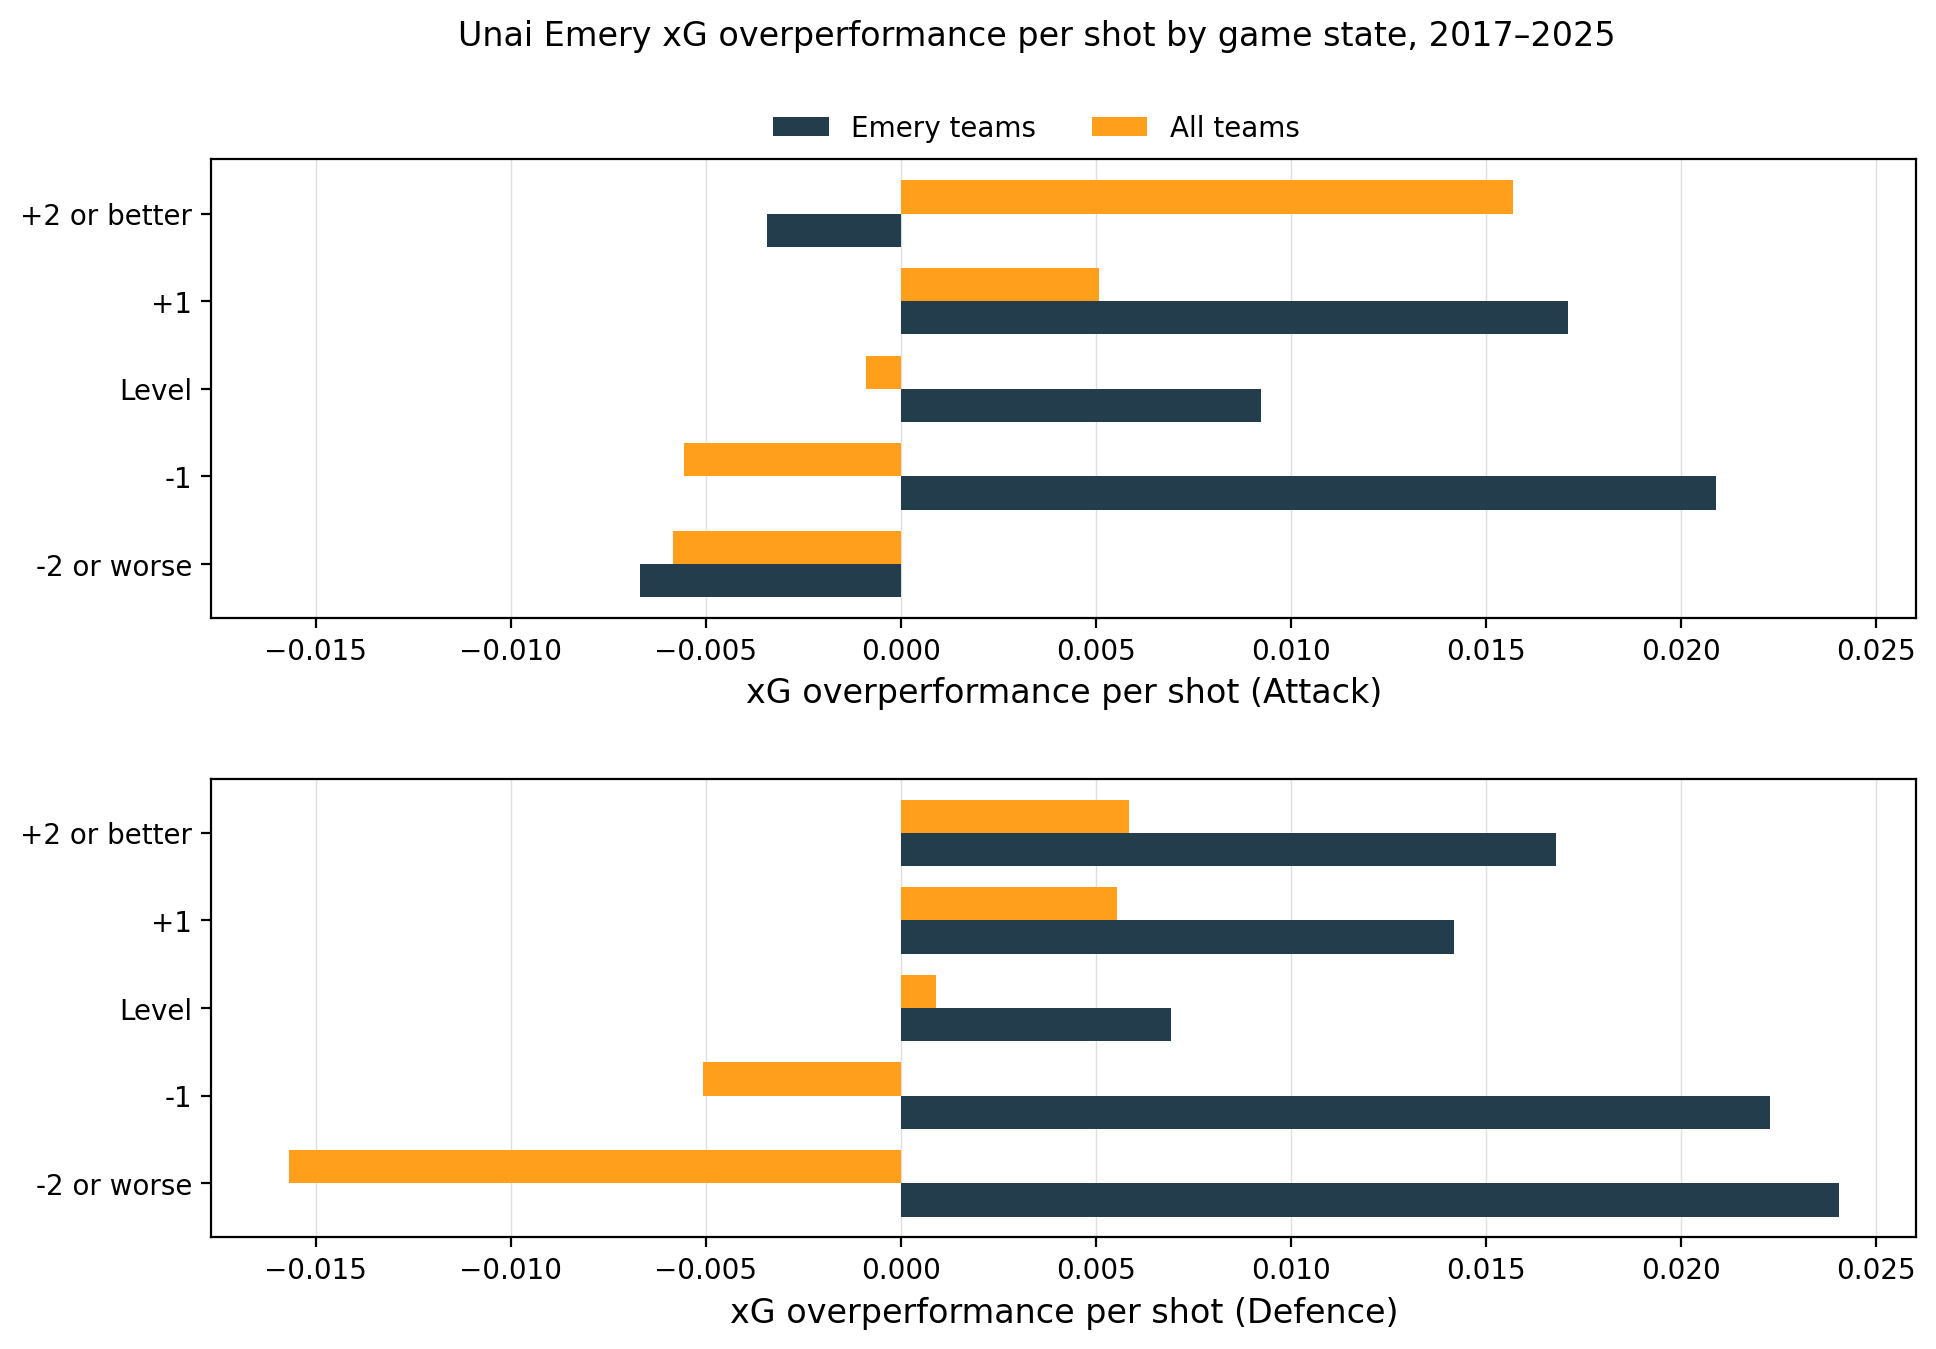
In attack, Emery’s teams tend to overperform their xG per shot in close games (leading by one, trailing by one, or level). In defence, they tend to overperform across the board.
The orange bars show the overall distribution for all teams: in attack, outperforming xG when leading, and underperforming xG when trailing. The trend is mirrored in defence, because one team’s attack is always another team’s defence. The implication here is intuitive: when you are chasing an equaliser, the opposition will keep more players back, and there will be less space to get shots off; players are more crowded and have to shoot quickly under duress. When leading, they are more likely to find themselves in friendly situations with fewer defenders back.
But there’s an obvious problem with these overall aggregated statistics. Good teams tend to be ahead more often, and bad teams tend to be behind, so this is likely to bias the results.
To account for this bias, I trained a regression model that used the log of the match odds (adjusted to remove the bookmaker’s overround) to represent the relative strengths of the two teams. The outcome variable was the difference between goals and xG on each shot, with game state, team strength and Emery as features along with interactions to capture different effects at each game state.
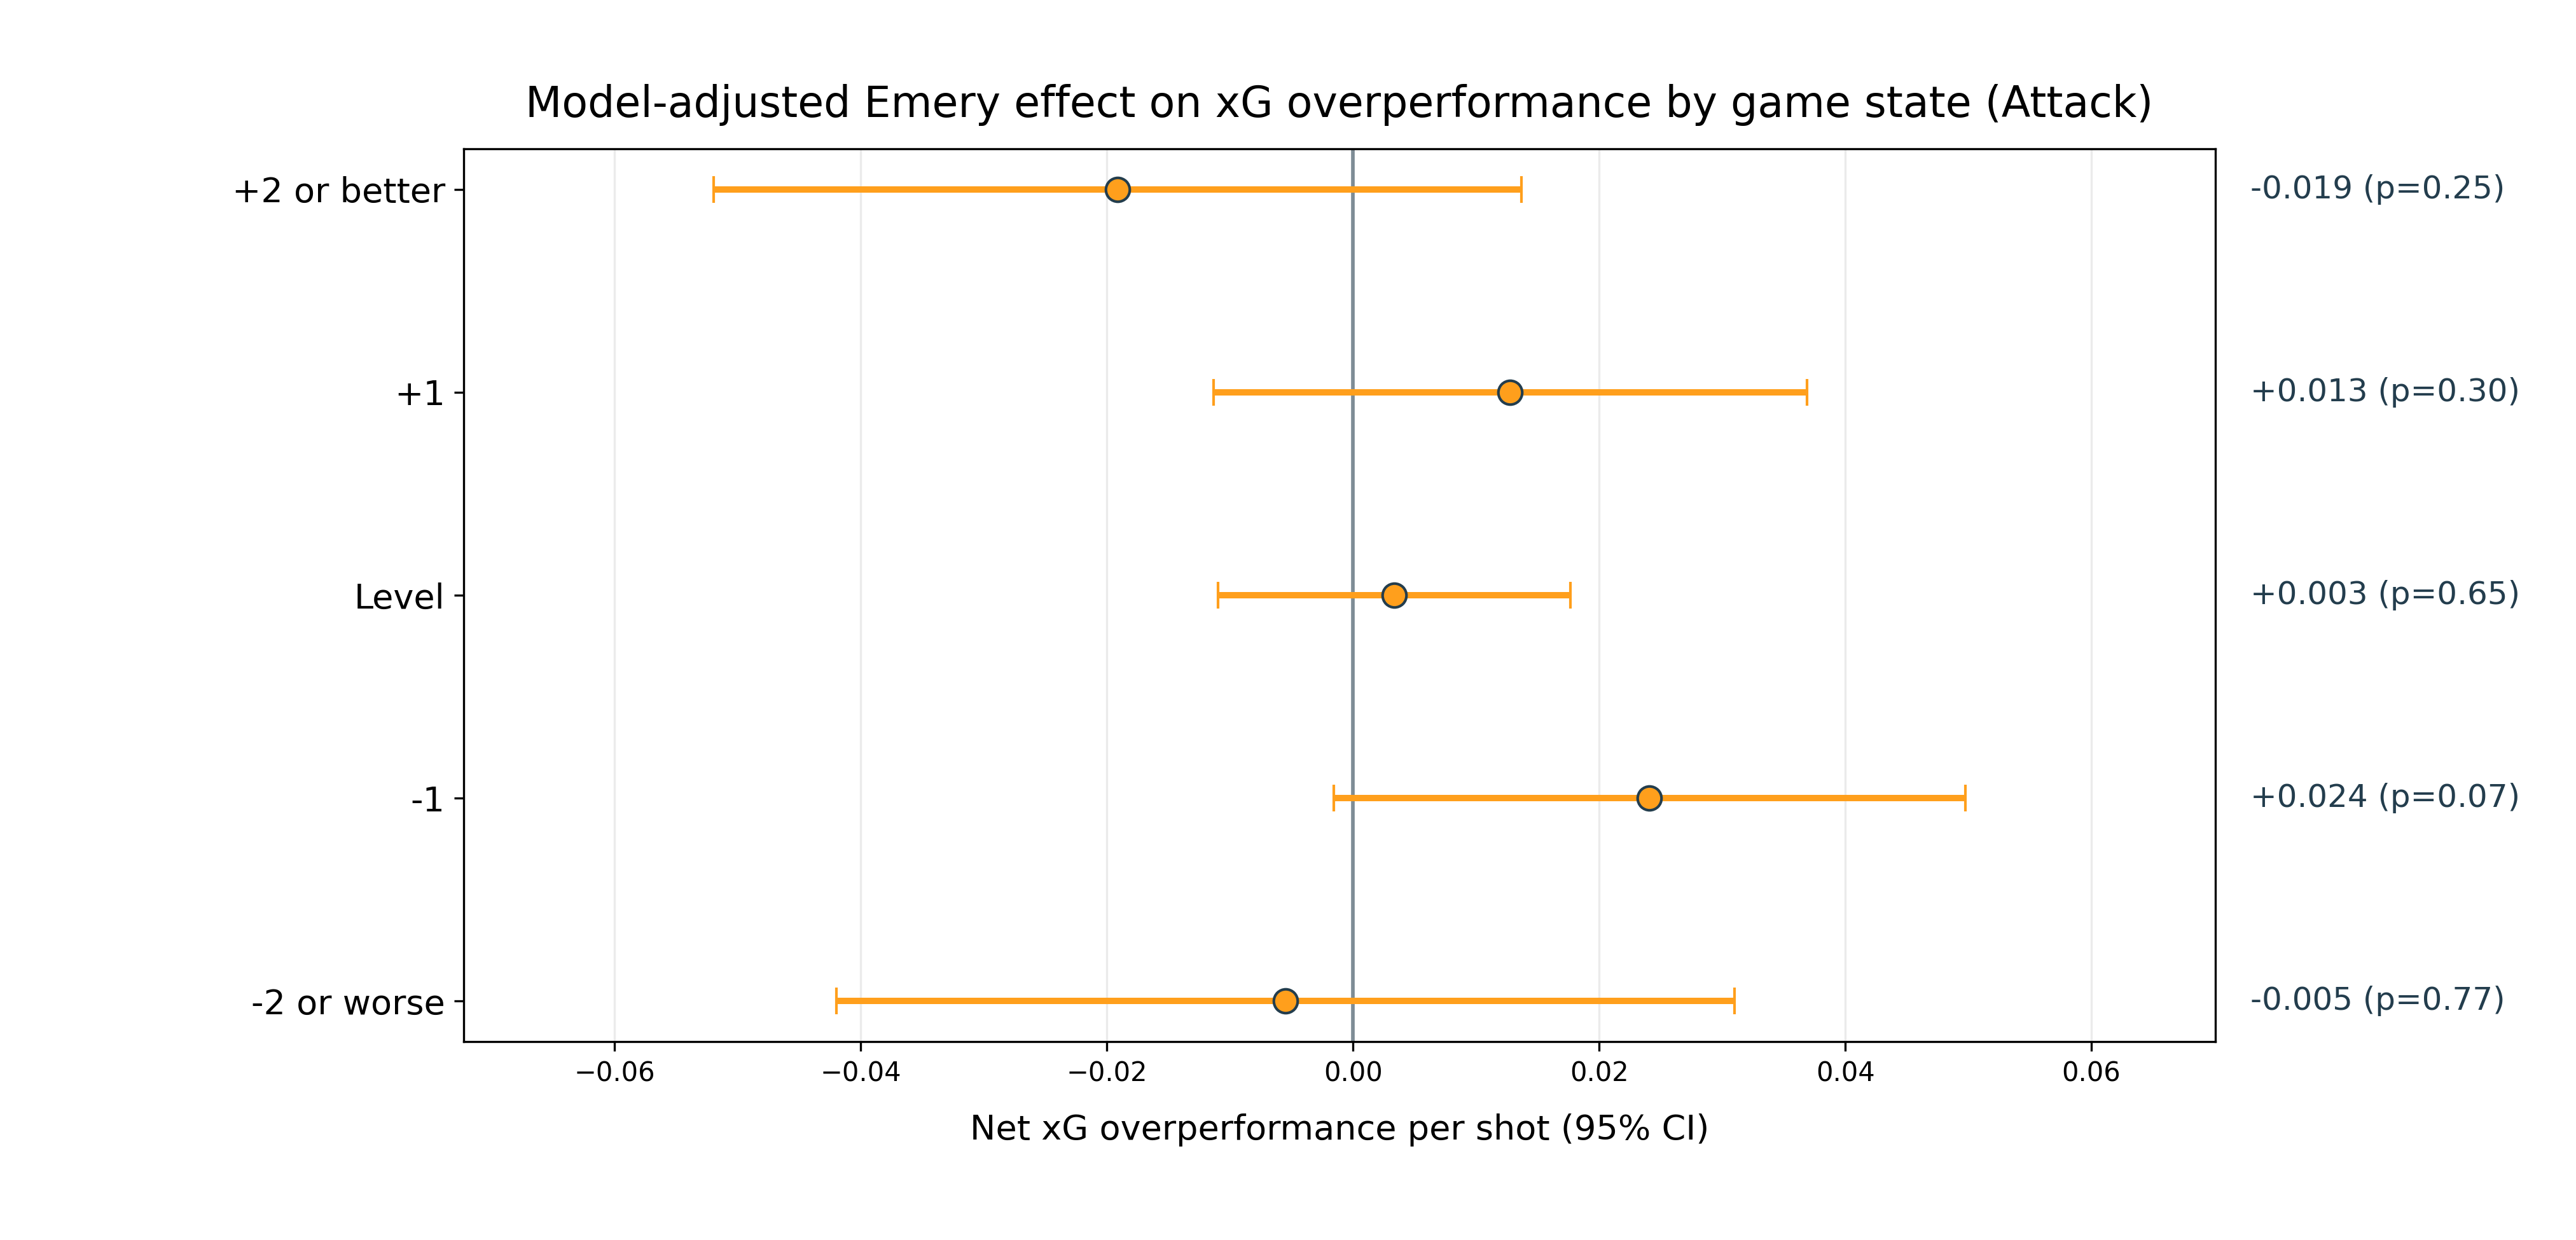
After accounting for team strength, Emery’s teams overperformed xG in attack by 0.024 goals per shot when trailing by one goal, and 0.013 per shot when leading by one goal. They actually underperformed in games that were not close (2 or more goal lead for either team).
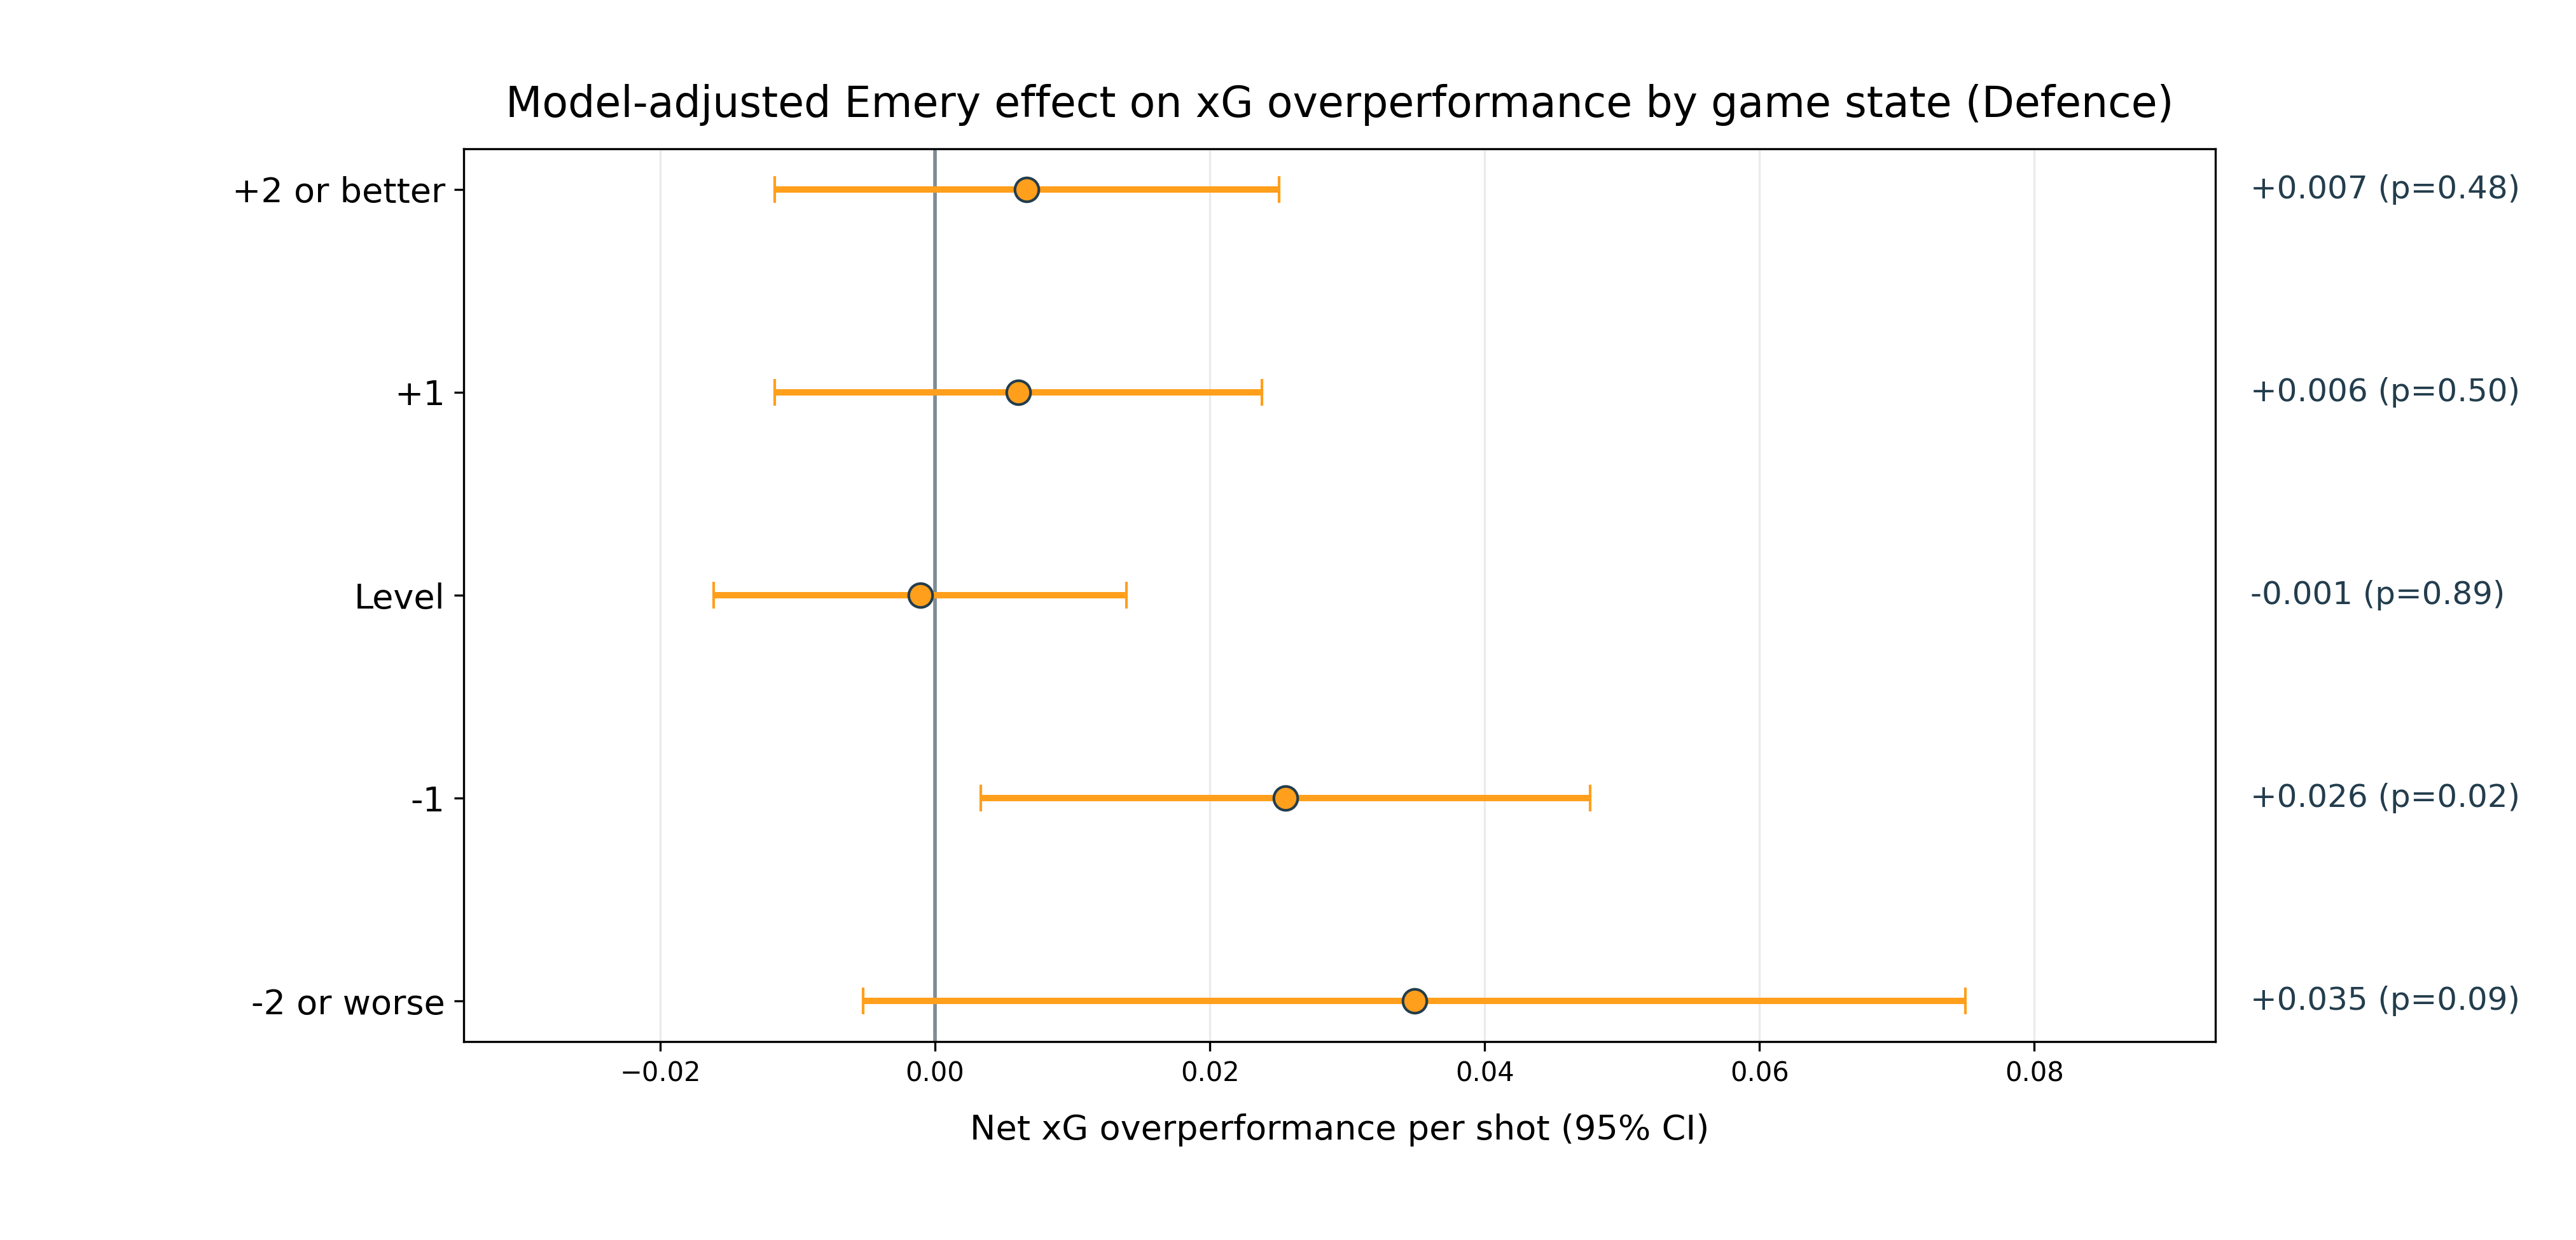
In defence, the largest overperformance was when trailing by two goals (+0.035 goals per shot) followed by one goal (+0.026). So when Emery’s teams were behind by one goal, they outperformed xG by similar amounts both offensively and defensively, and this is the scoreline at which Emery seems to create the biggest edge.
These amounts may sound small, but when you bear in mind that the average shot has an xG of around 0.11, a difference of 0.024 per shot would be more than a 20% increase in the number of goals.
There is one aspect of Villa’s current season that I haven’t yet covered, and that is the conversion of a +9 goal difference into 42 points, the same number of points as Manchester City who have a goal difference of +26. The only way to do that is with a lot of one-goal wins, and unsurprisingly Villa lead the Premier League in that category with 10 one-goal wins after 21 matches played.
| Most one-goal wins, 2025-2026 Premier League | |||
| Team | Played | One-goal wins | Total wins |
|---|---|---|---|
| Aston Villa | 21 | 10 | 13 |
| Arsenal | 21 | 8 | 15 |
| Fulham | 21 | 7 | 9 |
| Liverpool | 21 | 6 | 10 |
| Newcastle United | 21 | 5 | 9 |
| Manchester United | 21 | 5 | 8 |
| Sunderland | 21 | 5 | 7 |
| Manchester City | 21 | 4 | 13 |
| Everton | 21 | 4 | 8 |
| Crystal Palace | 21 | 4 | 7 |
| AFC Bournemouth | 21 | 4 | 6 |
| Brighton & Hove Albion | 21 | 3 | 7 |
| Brentford | 21 | 2 | 10 |
| Chelsea | 21 | 2 | 8 |
| Tottenham Hotspur | 21 | 2 | 7 |
| Nottingham Forest | 21 | 2 | 6 |
| Leeds United | 21 | 2 | 5 |
| Burnley | 21 | 1 | 3 |
| West Ham United | 21 | 1 | 3 |
| Wolverhampton Wanderers | 21 | 0 | 1 |
So is this also a part of Emery’s repertoire? It is not unreasonable to suppose that a manager might set up his team in such a way that they play conservatively with the lead and aggressively without it, increasing the chance of winning by exactly one goal and earning a greater number of points than the team’s goal difference would imply. If that is the case with Emery then it should show up in his results in previous seasons across each of his clubs.
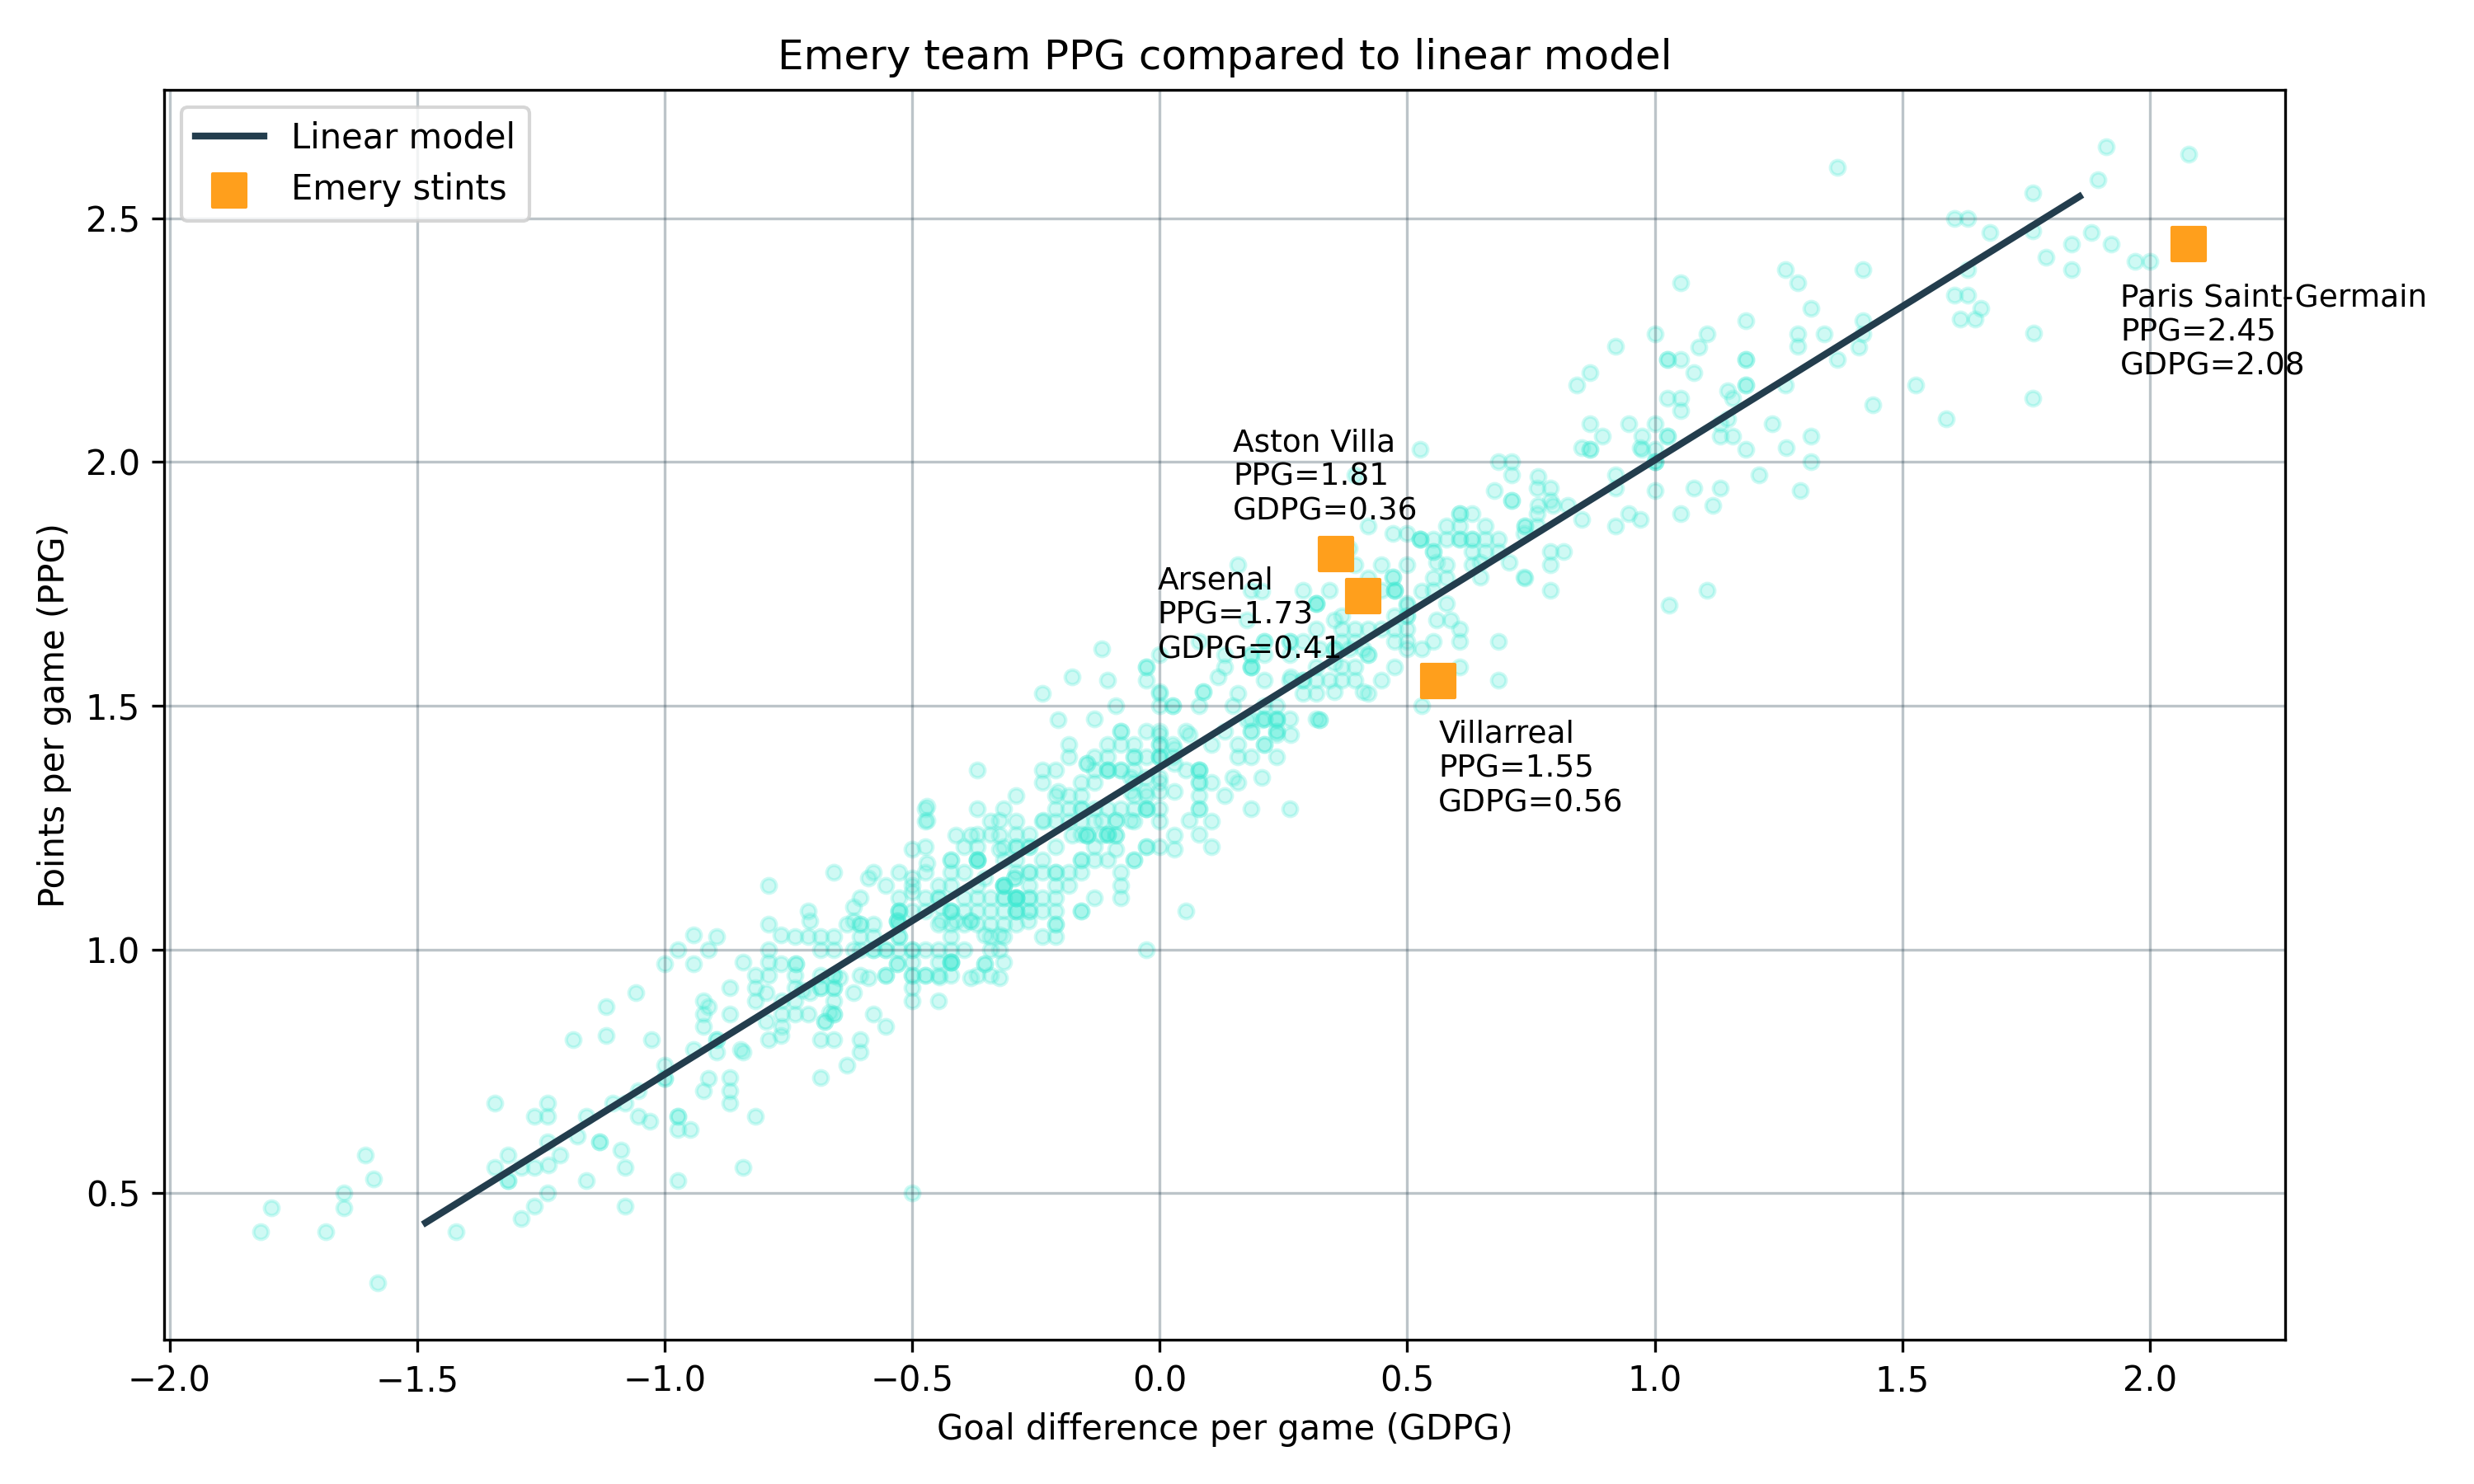
I entered the final points and goal difference for each team in each season of the study period and as you can see below, the relationship is linear. I have plotted the GDPG and PPG for Emery’s stints at his four clubs, and while Aston Villa and Arsenal lie above the line, Villarreal and PSG lie underneath. So it doesn’t seem like Emery is able to consistently overshoot his goal difference.
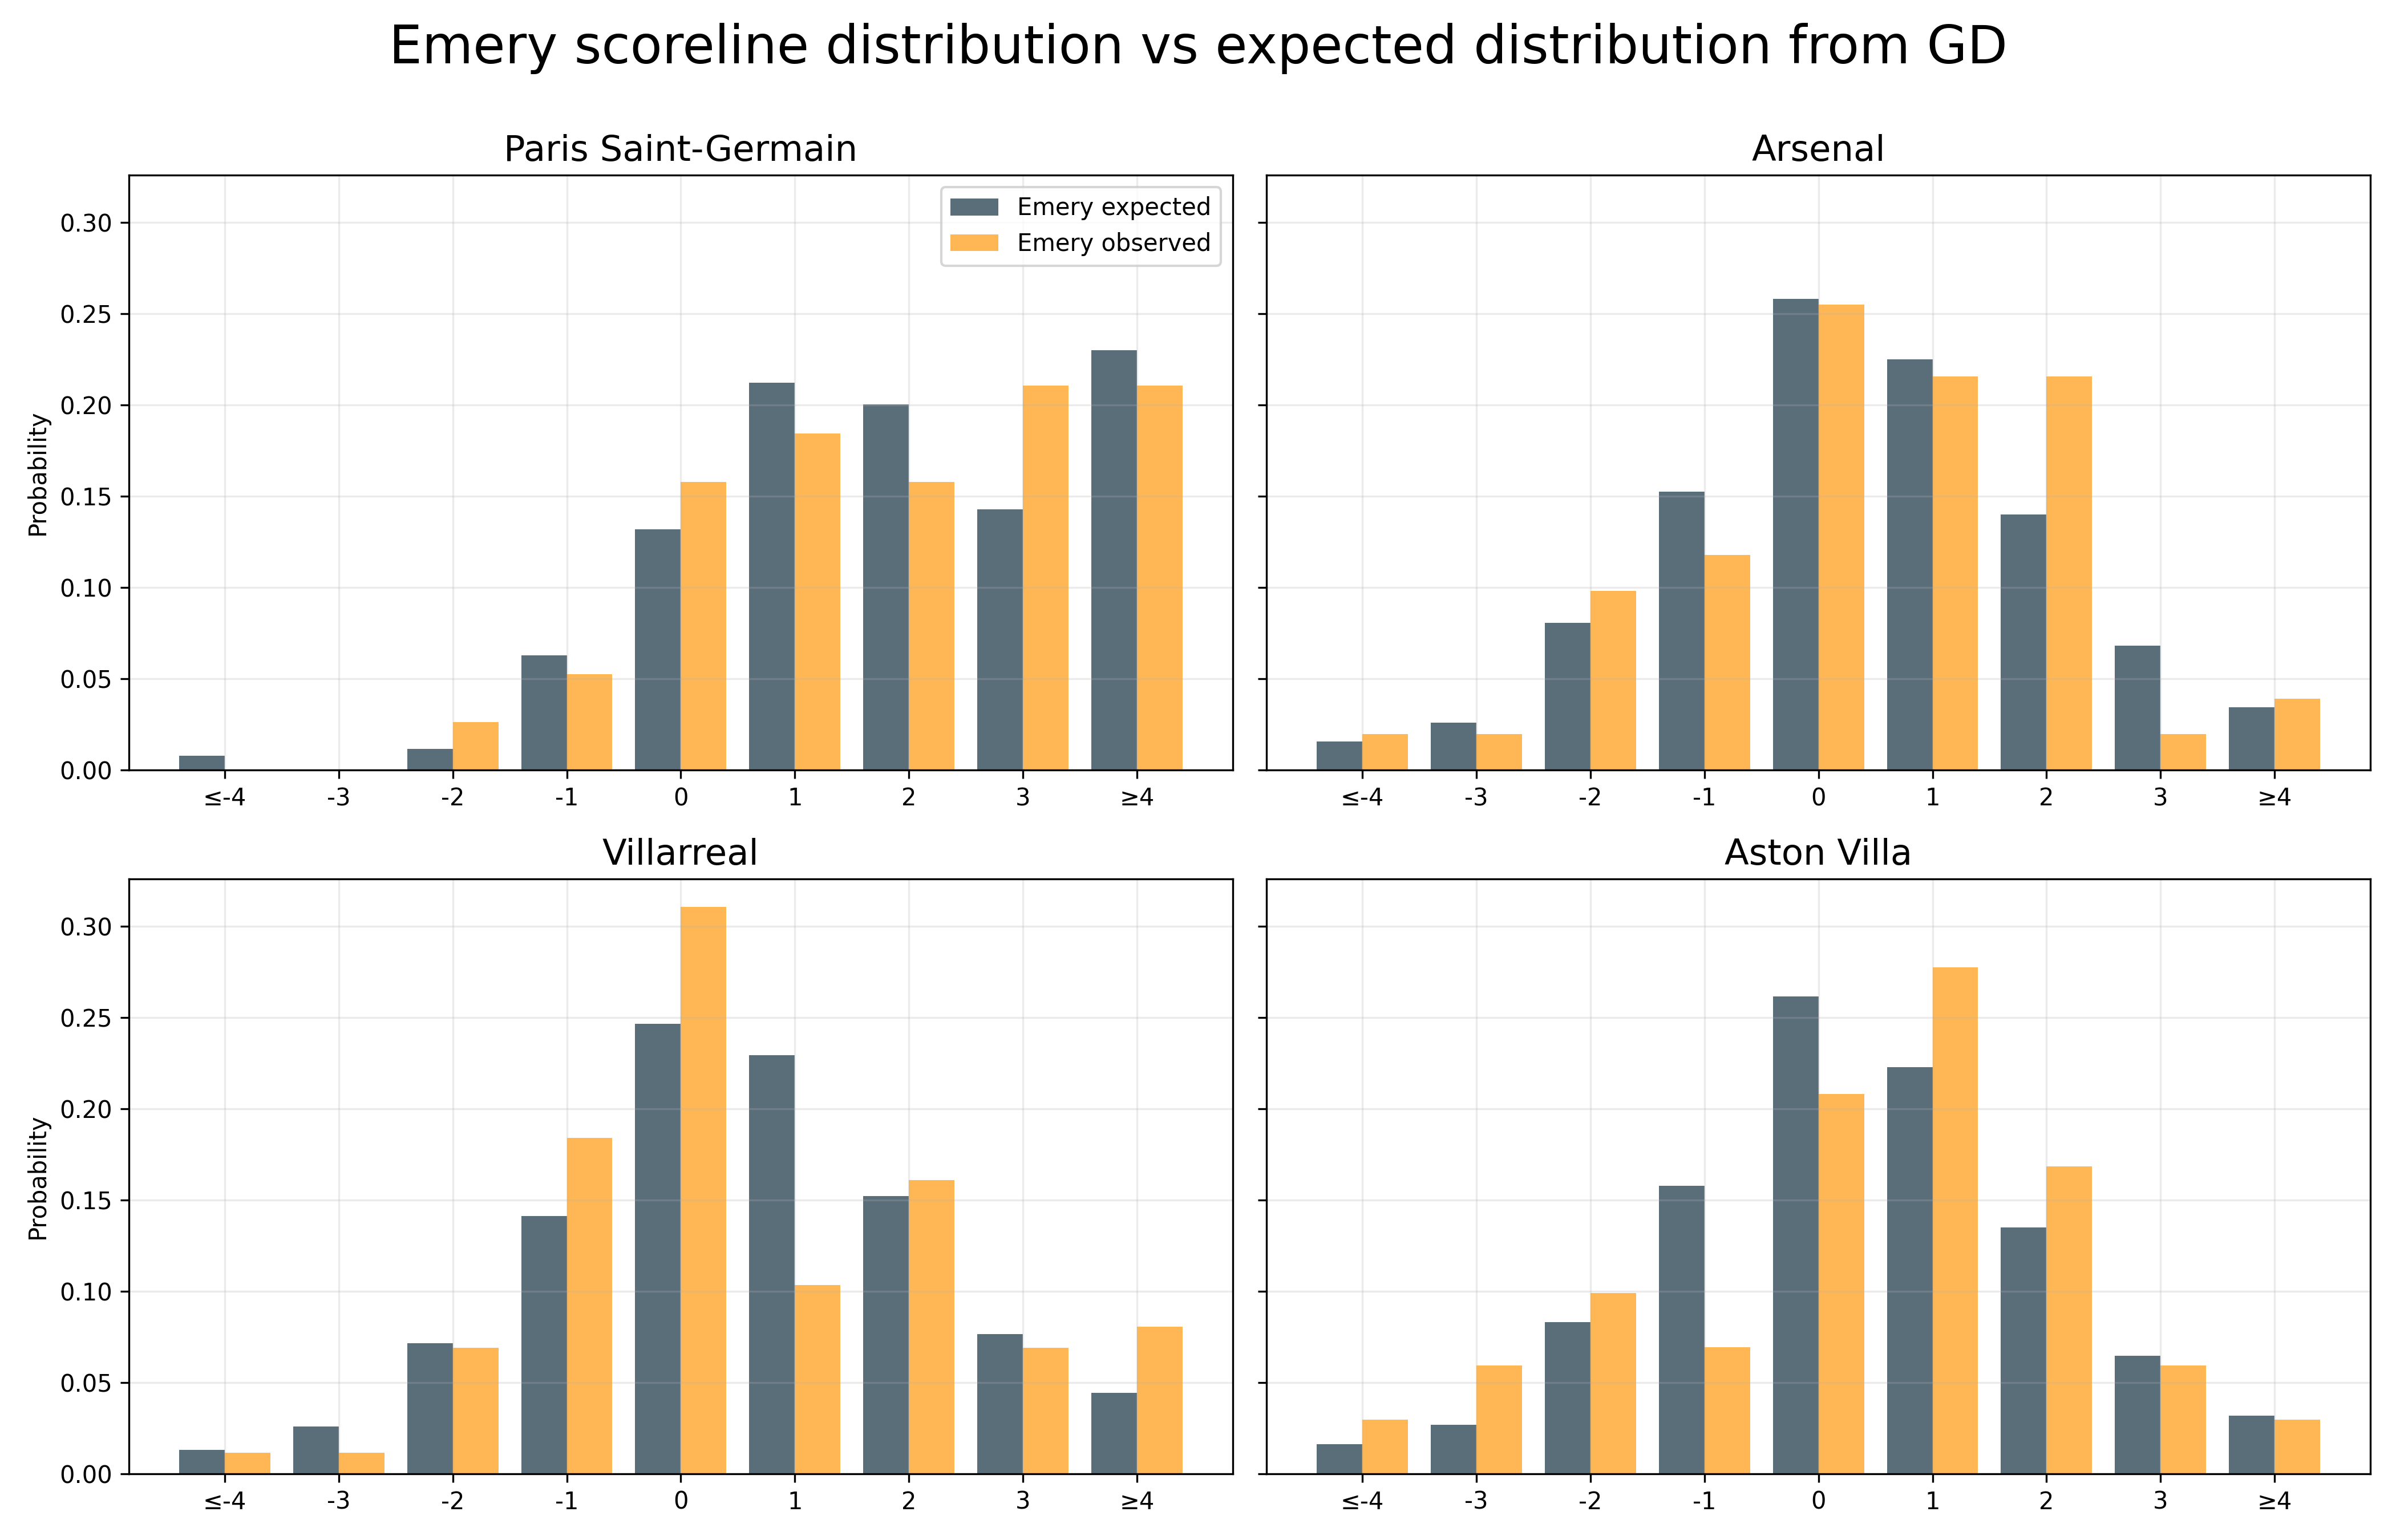
We can also look at Emery’s previous seasons to see whether he really does have an unusual number of one-goal wins. The side-by-side column charts below compare the score distribution of Emery’s teams alongside the distribution of teams in a similar bin of overall goal difference per game. Emery actually had fewer one-goal wins than expected at PSG, Arsenal and Villarreal; only with Aston Villa did he exceed the expected number of one-goal wins.
Takeaways
In part two, we have learned the following:
- All of Unai Emery’s four clubs in the study period overperformed their xG in both attack and defence.
- Emery overperformed xG more than the same teams did under other managers.
- Players who were hot finishers under Emery did not necessarily do the same under other managers.
- Emery’s largest xG overperformance came when trailing by one goal.
- There is no evidence to suggest Emery can consistently record one-goal wins and turn GD into excessive points.
Next up, in part three, I will try to answer the most important question: is any of this predictive? Can we expect Emery’s teams to keep doing this, or is it just statistical noise? And I will take a look at the match statistics from Emery’s teams to see if there are any aspects of his tactics that stand out.
© 2026 John Knight. All rights reserved.